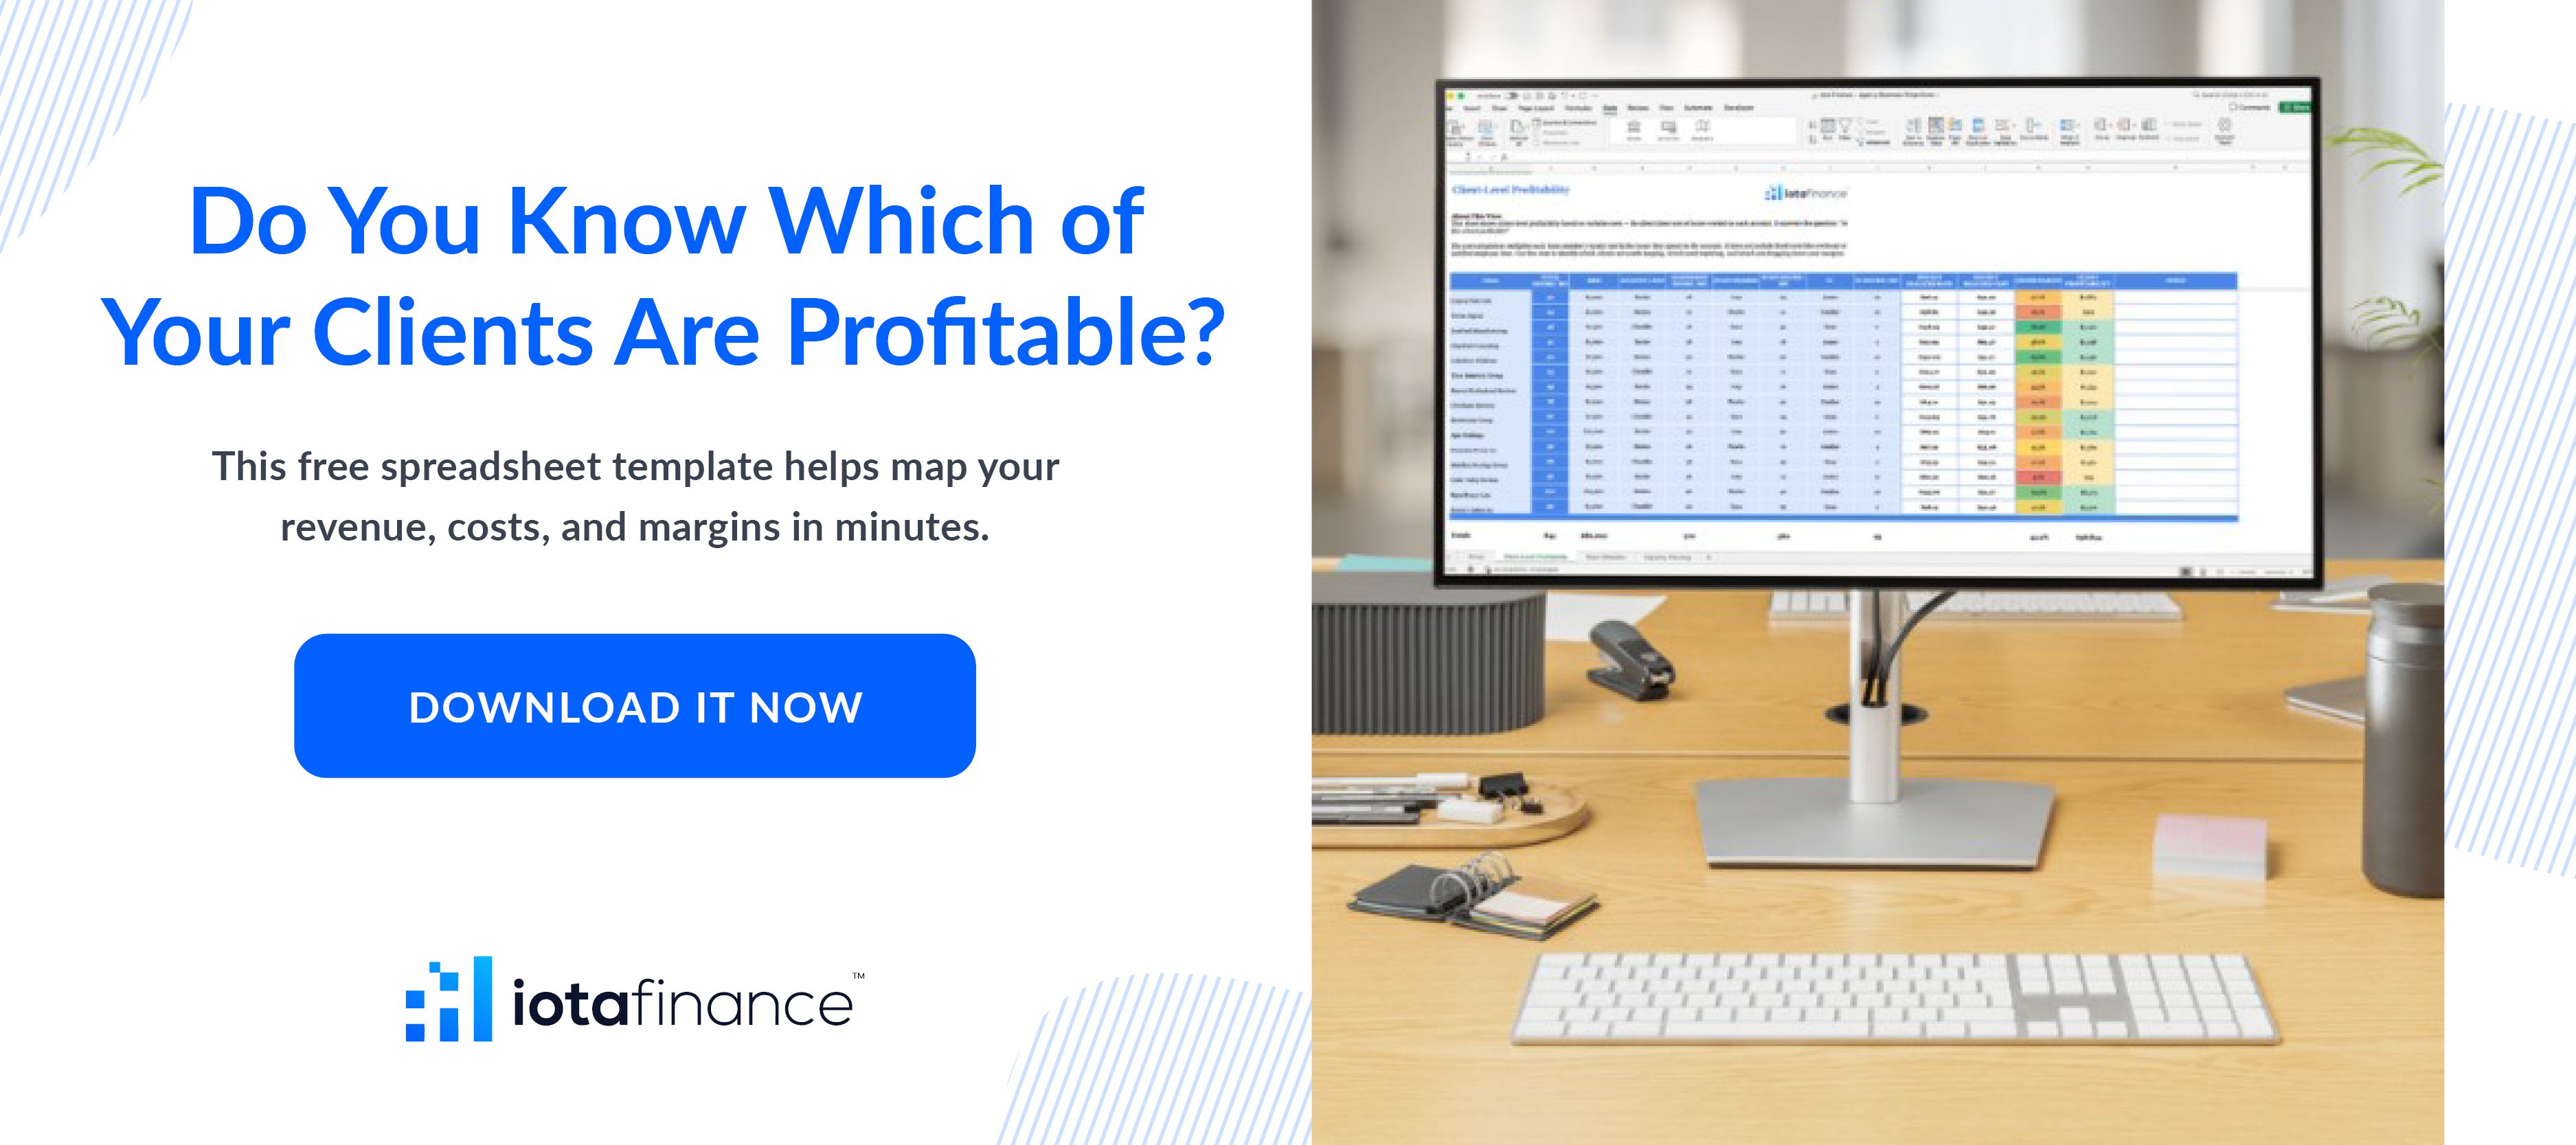
TL;DR
Most agency owners know their total revenue. Far fewer know which clients are actually responsible for their profit. Here are three things to keep in mind:
Gross margin by client tells a very different story than top-line revenue. A $15,000/month client can be less profitable than a $5,000/month one depending on how much it costs to serve them.
Hidden costs like scope creep, revision cycles, and senior team time rarely show up in a standard P&L. You need client-level cost allocation to see them.
The goal is action: repricing, restructuring scope, or redirecting business development toward the client types that consistently yield strong margins.
You closed a big retainer. Headcount is up. Revenue looks strong on paper. And yet somehow, cash flow still feels tight at the end of the month.
This is one of the most common patterns in agency finance, and it almost always points to the same underlying issue: the agency is measuring the wrong thing. Revenue tells you how much came in. It tells you nothing about what it cost to earn it.
Say your agency carries eight clients. Two of them account for 40% of your total revenue. But if those same two clients demand a ton of your time, generate the most revision requests, and have been on the same retainer rate for two years while their scope has quietly expanded, their margin may be worse than your smallest account.
Client profitability analysis changes that picture. It gives agency owners a clear view of margin at the individual client level so you can stop managing by revenue and start managing by what actually matters.
What Client Profitability Analysis Actually Measures
Client profitability analysis is the process of measuring true profit, not just revenue, on a per-client basis. It accounts for all costs directly tied to serving that client: labor, subcontractors, software, and a proportionate share of overhead.
The output is a gross margin figure for each client. Here's a simple example of why it matters:
- Client A bills $10,000/month. After labor, contractor costs, and allocated overhead, the true cost to serve is $7,500. Gross margin: 25%.
- Client B bills $5,000/month. After costs, the true cost to serve is $2,500. Gross margin: 50%.
On revenue alone, Client A looks like the more valuable relationship. On margin, Client B is twice as profitable per dollar earned.
Agencies generally aim for gross margins of 50–70% per client to sustain healthy agency-wide margins of 40–60% after accounting for non-billable time, overhead, and slower periods. Without client-level visibility, it's difficult to know whether you're hitting those targets, or quietly subsidizing unprofitable relationships with income from your best clients.
For more on how billing cycles and cash flow interact with your client mix, see Agency Cash Flow Management: How to Stop Living Invoice to Invoice.
How to Calculate Gross Margin at the Client Level
Building client-level profitability starts with getting the right costs in. There are two categories to account for.
Direct costs are expenses tied specifically to that client's work: staff hours at fully loaded cost (including salary, payroll taxes, and benefits), freelancer and subcontractor fees, and any software purchased for that engagement. Pass-through expenses like media spend are typically excluded since they are billed back to the client.
Allocated overhead is where agencies consistently undercount costs. Rent, shared software subscriptions, management time, and administrative support all have a real cost. A common approach is to allocate overhead proportionally based on each client's share of total revenue or labor hours consumed.
The formula:
Client Gross Margin = (Client Revenue – Direct Costs – Allocated Overhead) ÷ Client Revenue
Time tracking is the foundational input here. Without knowing how many hours each team member actually spends on a given client, the cost side of the equation is a guess. Hours logged against each client, multiplied by the fully loaded cost rate for each team member, give you the actual labor cost to serve that account.
💡 Key Insight: Loading labor costs correctly is the most common place agencies undercount true client costs. Use fully loaded rates, including payroll taxes and benefits, when calculating how much a client actually costs to serve. Understating labor costs will make unprofitable clients appear to be breaking even.
The Four Client Types You'll Find in Your Book of Business
Once you have client-level margin data, your book of business will typically sort into one of four categories.
Stars (High Margin, High Strategic Value): These clients are profitable and represent the type of work you want more of. Protect these relationships. Assign your strongest team members and invest in them proactively.
Workhorses (High Margin, Lower Strategic Value): These clients fund the agency reliably even if the work is not the most exciting. Manage them efficiently, avoid overservicing, and maintain the margin without adding cost.
Question Marks (Low Margin, High Strategic Value): These are clients in a sector you want to break into, or relationships with meaningful referral potential, but the current engagement is not profitable. Have a clear plan: can you adjust pricing or scope to improve the margin? Without that discipline, question marks can quietly become long-term drains.
Drains (Low Margin, Low Strategic Value): These clients consume disproportionate time and energy relative to what they generate. The profitability data gives you the evidence to support a repricing conversation, a scope restructure, or in some cases an offboarding decision.
Our Fractional CFO services can help you build the reporting framework to do this segmentation consistently, not just once.
The Hidden Costs That Distort Your Margins
Even agency owners who track time miss costs that quietly erode client-level margins.
Senior team hours on low-rate clients. If a principal is spending 10 hours per month on a $6,000/month retainer and their fully loaded cost is $150/hour, you have allocated $1,500 in labor before any junior time is added. That single oversight can shift a 50% margin engagement to a 30% one.
Scope creep without corresponding revenue. A client who started as a $4,000/month retainer but now expects weekly strategy calls and unlimited revisions may effectively be a $2,000/month client in margin terms. Without tracking hours against a defined scope, these overruns tend to accelerate over time, not stabilize.
Onboarding costs. The first 60 to 90 days of a new client relationship often involve more hours than the billing reflects. This is worth factoring in when evaluating the lifetime margin of a relationship, not just the steady-state months.
Churn costs. Losing a client means lost revenue and the cost of replacing them through sales time, proposals, and onboarding. Proactively managing profitability is, in part, a retention strategy, and retention is one of the most cost-effective levers available to agency owners.
💡 Key Insight: The most expensive clients are rarely the ones with the lowest billing rates. They are the ones with the highest service cost relative to what they pay. Reviewing how senior team time is allocated across clients is often the fastest way to identify where margin is being lost.
Turning Analysis Into Action
Reprice underperforming engagements. If a client has been at the same rate for 18 months while scope has expanded, the analysis provides the basis for a rate conversation. Frame it around the value being delivered, not internal cost pressures.
Restructure scope. For clients where margin is low but the relationship is worth preserving, tightening deliverables, introducing a change-order process, or moving to a tiered retainer model can bring the engagement back to a sustainable level.
Redirect business development. If branding strategy engagements consistently yield 60% margins while social content retainers hover around 25%, that should shape where you spend your sales energy. Intentionally shifting your client mix toward higher-margin service types is one of the most durable ways to improve agency profitability over time.
Guide staffing decisions. Knowing which clients generate the most margin helps you prioritize where to allocate senior talent and evaluate whether a new hire would generate a positive return based on your existing book.
For more on the tax side of agency ownership, see Beyond Tax Deductions: The Moves That Save Marketing Agencies Real Money.
💡 Key Insight: Client profitability data is most valuable as an ongoing management tool, not a one-time audit. Reviewing margin by client quarterly gives agency owners an early warning system for relationships that are drifting out of profitability, before they become bigger problems.
Build the Visibility to Run a More Profitable Agency
The larger opportunity for most agency owners is not in landing a new anchor client. It is in the margin hiding inside their existing book of business.
Client profitability analysis does not require sophisticated software or a full-time finance team, but it does require clean books, consistent time tracking, and a clear picture of how costs are allocated at the client level.
At Iota Finance, we help marketing, creative, and professional services agencies build the financial visibility that supports smarter decisions, including accounting systems structured to track revenue and costs by client and monthly reporting that makes margin visible without extra work on your end.
If you want to know which clients are making you money, and which ones are not, schedule a profitability review with our team.
Disclaimer: This article is for informational purposes only. Benchmarks referenced represent commonly cited industry ranges and may vary based on agency type, size, and service mix. For guidance tailored to your agency's specific financial situation, contact Iota Finance.